I was debating with myself whether this was too basic to bring up but after writing it, I’m glad I did.
Referencing scikit-learn’s confusion matrix documentation, it’s not immediately apparent what convention the axes follow. When the confusion_matrix function is called,
from sklearn.metrics import confusion_matrix
y_true = [0, 0, 0, 1, 1, 1, 1, 1, 1, 1]
y_pred = [0, 1, 1, 0, 0, 0, 1, 1, 1, 1]
cm_2 = confusion_matrix(y_true, y_pred)
cm_2
we get the following output:
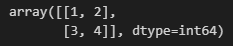
So which value corresponds to True Negative, True Positive, False Negative, False Positive?
A quick Google search on “confusion matrix” shows:
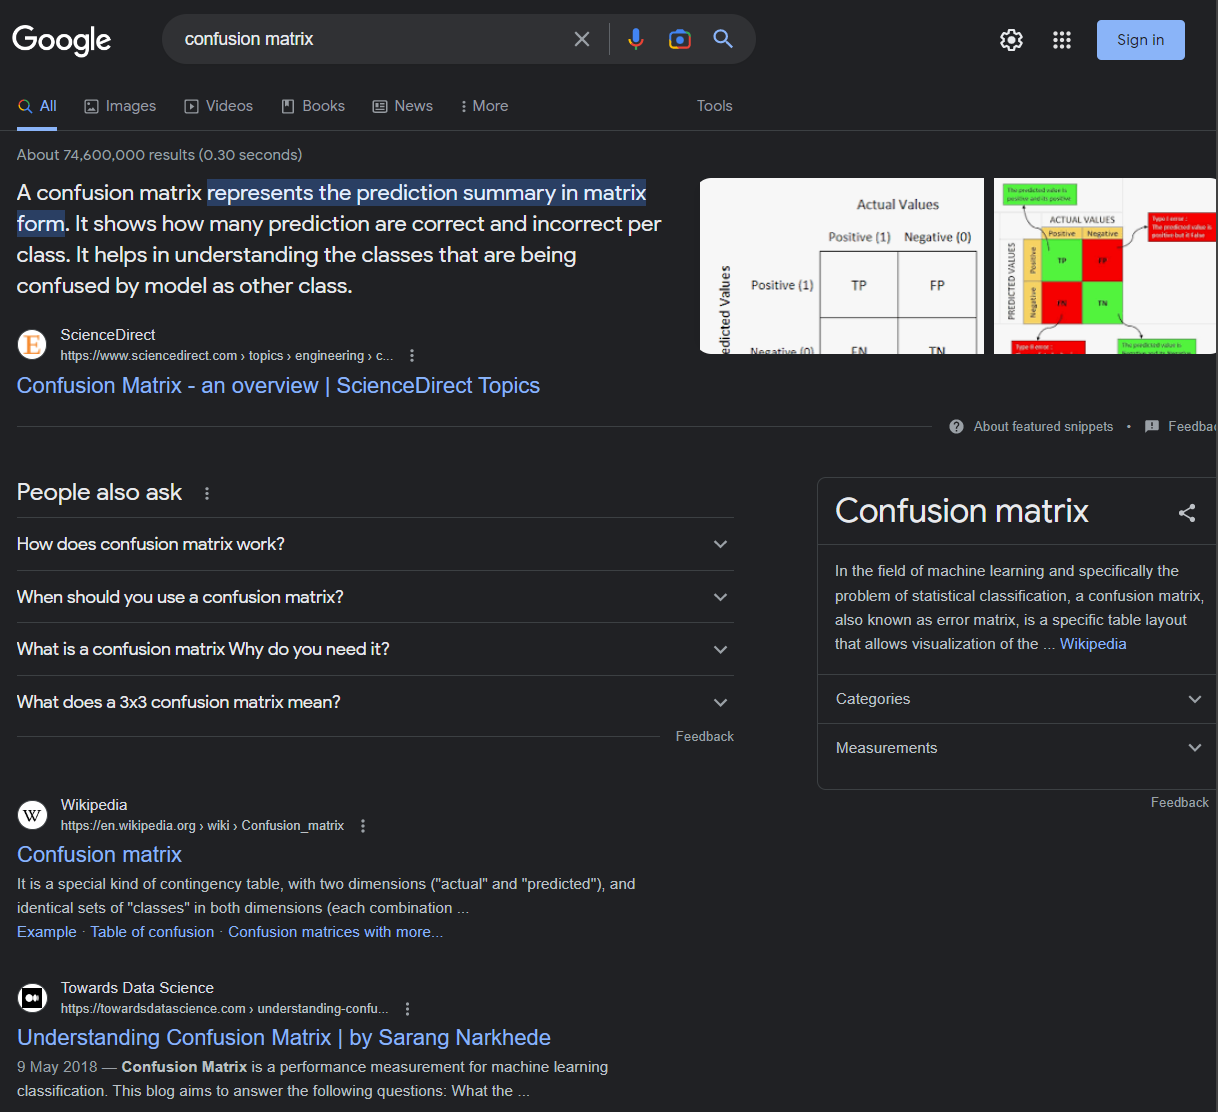
And clicking through, we see different illustrations of it.
https://www.sciencedirect.com/science/article/abs/pii/B9780128240540000265

https://www.sciencedirect.com/science/article/abs/pii/B9780323911979000138

https://www.sciencedirect.com/science/article/abs/pii/B9780128183663000058

So which is it for the scikit-learn confusion_matrix function output?


Let’s look at it again:
from sklearn.metrics import confusion_matrix
y_true = [0, 0, 0, 1, 1, 1, 1, 1, 1, 1]
y_pred = [0, 1, 1, 0, 0, 0, 1, 1, 1, 1]
cm_2 = confusion_matrix(y_true, y_pred)
cm_2
We can see that the terms in the predicted list y_pred are:
[TN, FP, FP, FN, FN, FN, TP, TP, TP, TP]
And the count of the terms are:
Actual_0_Predicted_0 (True Negative) = 1
Actual_0_Predicted_1 (False Positive) = 2
Actual_1_Predicted_0 (False Negative) = 3
Actual_1_Predicted_1 (True Positive) = 4
Matching the confusion_matrix output and the count of the terms, we can see that the matrix is arranged as such:


We’ll plot it with a seaborn heatmap and label the axes appropriately:
import seaborn as sns
sns.heatmap(cm_2, annot=True, cmap='Blues').set(xlabel='Predicted Class', ylabel='Actual Class')

Addendum: If you simply can’t commit to memory the confusion_matrix function’s output order, one hacky way to check what you need is by assigning them like so:
cm_2 = confusion_matrix(y_true, y_pred)

tn = cm_2[0][0]
fp = cm_2[0][1]
fn = cm_2[1][0]
tp = cm_2[1][1]
This is easy to remember as:
True Negative = Actual_0_Predicted_0
False Positive = Actual_0_Predicted_1
False Negative = Actual_1_Predicted_0
True Positive = Actual_1_Predicted_1
I don’t see it written anywhere but it’s quite possible the scikit-learn developers intentionally chose their confusion matrix array/axis arrangement so as to match the indexing of a 2D array, which is pretty nifty.
Now that we’re clear about it, there’s an error in this illustration, can you see what it is and how to correct it?
https://datagy.io/python-confusion-matrix/

(correction needed = swap the axes)
You can play around with the following Google Colab Notebook to help build some intuition. Scroll down for a multi-class confusion matrix.

Discussion
Comments are closed.